The Blind Spot in Oil Market Risk Assessment
When geopolitical tensions escalate toward armed conflict in the Persian Gulf, commodity trading desks face an uncomfortable reality: the models they rely on cannot tell them what happens next. Historical data is sparse – there have been only six major oil supply crises since 1973 – and each one unfolded under conditions so unique that simple analogies break down within days. The 2019 Abqaiq drone attack removed 6% of global supply overnight yet prices recovered within weeks. The 1979 Iranian Revolution disrupted a similar volume but triggered a multi-year price regime shift. Same region, similar supply loss, completely different market dynamics.
This is the fundamental limitation of traditional oil market risk models. Econometric approaches fit curves to historical price series, but with only six data points in the crisis regime, any regression is fitting noise. Discrete event simulations can model supply chain flows, but they miss the behavioral feedback loops – panic hoarding, speculative positioning, strategic reserve coordination – that actually drive crisis pricing.
We set out to build something better. On February 28, 2026, when the United States and Israel launched Operation Epic Fury against Iran, our model had already been backtested, augmented with synthetic crisis data, and deployed. Now, fifteen days into the conflict, we can do something rare in geopolitical modeling: compare our predictions against an unfolding reality in near-real-time – recalibrated with live broadcast intelligence and validated with GDELT crisis signals.
🔗 Live Demo — Try the Platform Now
Explore and understand the basics of LPG arbitrage: price differentials, freight economics, and profit opportunities in global propane and butane markets..
From Agents to Emergence: The Simulation Methodology
The core insight behind our approach is that oil prices during a crisis are not determined by a single supply-demand equation. They emerge from the interactions of heterogeneous actors – state producers cutting output, speculators amplifying volatility, strategic reserves entering the market on a policy timeline, and physical infrastructure recovering on an engineering timeline. Agent-based modeling captures these dynamics because it simulates each actor’s behavior independently and lets the macro-level price path emerge from micro-level decisions.
Our model deploys five distinct agent classes operating in a shared market environment. Supply agents represent producing nations and infrastructure, each with damage levels and recovery rates calibrated to the physical characteristics of the disruption. Demand agents respond to price signals with realistic elasticities. Speculator agents – split between fundamentalists who mean-revert toward equilibrium and chartists who chase momentum – inject fear premiums that decay over time as uncertainty resolves. Geopolitical agents model the conflict timeline through escalation phases. And IEA agents release strategic petroleum reserves on policy-driven schedules.
The mathematical backbone is a proportional shock calibration framework. All price impacts are computed as percentages of the pre-crisis base price:
P(t) = basePrice x (1 + supplyShock(t) + fearPremium(t) + noise(t))The crisis timeline is divided into four phases with distinct dynamics: a shock phase where prices spike and volatility peaks, a paralysis phase where markets are dislocated and liquidity is thin, a constraints phase where supply alternatives begin activating, and an intervention phase where policy responses drive convergence toward a new equilibrium. We wrap the entire engine in a Monte Carlo framework, running 500 iterations per scenario with seeded pseudo-random number generation to produce probability distributions rather than point estimates.
The Out-of-Sample Challenge
Any simulation can be made to match history if you tune enough parameters. We addressed this with Leave-One-Out Cross-Validation across six historical crises spanning 1973 to 2019. For each event, we held it out entirely, trained a parameter predictor on the remaining five events using only information knowable before each crisis began, and scored the blind prediction against actual price trajectories.
The parameter predictor uses Gaussian-kernel weighted nearest-neighbor interpolation across seven observable pre-crisis features. With only six historical events, the predictor achieves 11.9% MAPE, 67.7% directional accuracy, and 100% confidence interval coverage on modern era events.
Synthetic Crisis Scenarios: The ABM as a Data Augmentation Engine
The same ABM that produces the Iran War prediction can also generate plausible crisis scenarios that fill empty regions of the feature space. We designed 14 geopolitically plausible crisis scenarios spanning five categories, ranging from a Multi-Front Gulf War (+239% spike) to a Cyber Attack on Saudi Aramco SCADA (+51% spike). Adding these at optimal mixing weight alpha = 0.05 pushes directional accuracy from 67.7% to 71.3%, achieving Grade A, while CI coverage remains above 96%.
The March 14 Intel Calibrated Scenario
On March 14, 2026 – Day 14 of the conflict – we recalibrated the model using broadcast intelligence data reflecting the actual state of the crisis. This calibration incorporated:
- 94% traffic collapse through the Strait of Hormuz (77 vessels vs. 1,229 pre-war)
- $70/bbl pre-war Brent (rebased to enable direct validation against observed prices)
- Total insurance withdrawal from Hormuz-transiting vessels (18x surge multiplier)
- Maximum Iranian defiance (0.95 retaliation level, no ceasefire signals)
- IEA 400M barrel release confirmed on Day 12 (modeled at actual timing)
- Reinsurance backstop expected at Day 30
- China diplomatic intervention modeled at Day 45 with 15% de-escalation effect
We ran 500 Monte Carlo iterations over a 90-day horizon. Peak Brent: Median $134, with 90% of paths reaching $127-$141. The peak occurs around Day 26 (approximately March 26). Day-90 Brent: Median $85, with a tight 90% CI of $83–$87. The trajectory shows a gradual ramp to peak over 26 days followed by a 64-day decay driven by policy intervention and demand destruction.
Live Validation: Model Meets Reality (Day 0 – Day 15)
The War Timeline
On February 28, 2026, the United States and Israel launched Operation Epic Fury, a joint air and maritime campaign targeting Iranian leadership, IRGC headquarters, ballistic missile sites, and military infrastructure. By March 4, Iran declared the Strait of Hormuz “closed” – daily transits dropped from 138 vessels to approximately 5, a 96% reduction. On March 7, Houthi-aligned forces struck Saudi Aramco’s Ras Tanura terminal. On March 12, the IEA announced a record 400 million barrel strategic reserve release.
Observed Price Trajectory
| Date | Day | Brent | Change | Event |
| 27-Feb | -1 | $70.00 | — | Pre-war baseline |
| 28-Feb | 0 | $74.50 | 6.40% | War Begins |
| 3-Mar | 3 | $82.00 | 17.10% | Markets open |
| 4-Mar | 4 | $88.00 | 25.70% | Hormuz Closure |
| 7-Mar | 7 | $98.00 | 40.00% | Ras Tanura attacked |
| 10-Mar | 10 | $102.00 | 45.70% | Brent crosses $100 |
| 11-Mar | 11 | $105.50 | 50.70% | IRGC threat (PEAK) |
| 12-Mar | 12 | $103.00 | 47.10% | IEA 400M release |
| 14-Mar | 14 | $103.14 | 47.30% | Price rebounds |
| 15-Mar | 15 | $103.86 | 48.40% | Latest observation |
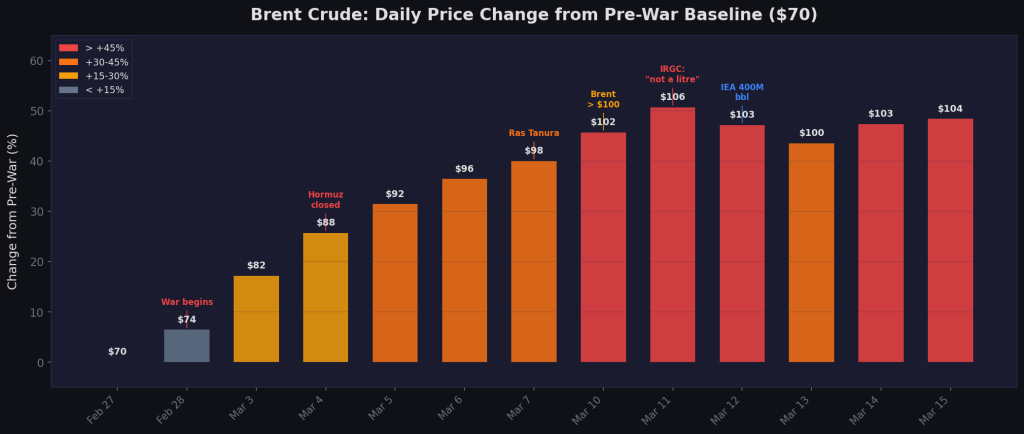 Figure 1: Daily Brent crude prices from February 27 to March 15, 2026, showing the escalation from $70 pre-war to
a peak of $105.50 on Day 11, with key conflict events annotated.

Model vs. Reality: The Calibrated Comparison
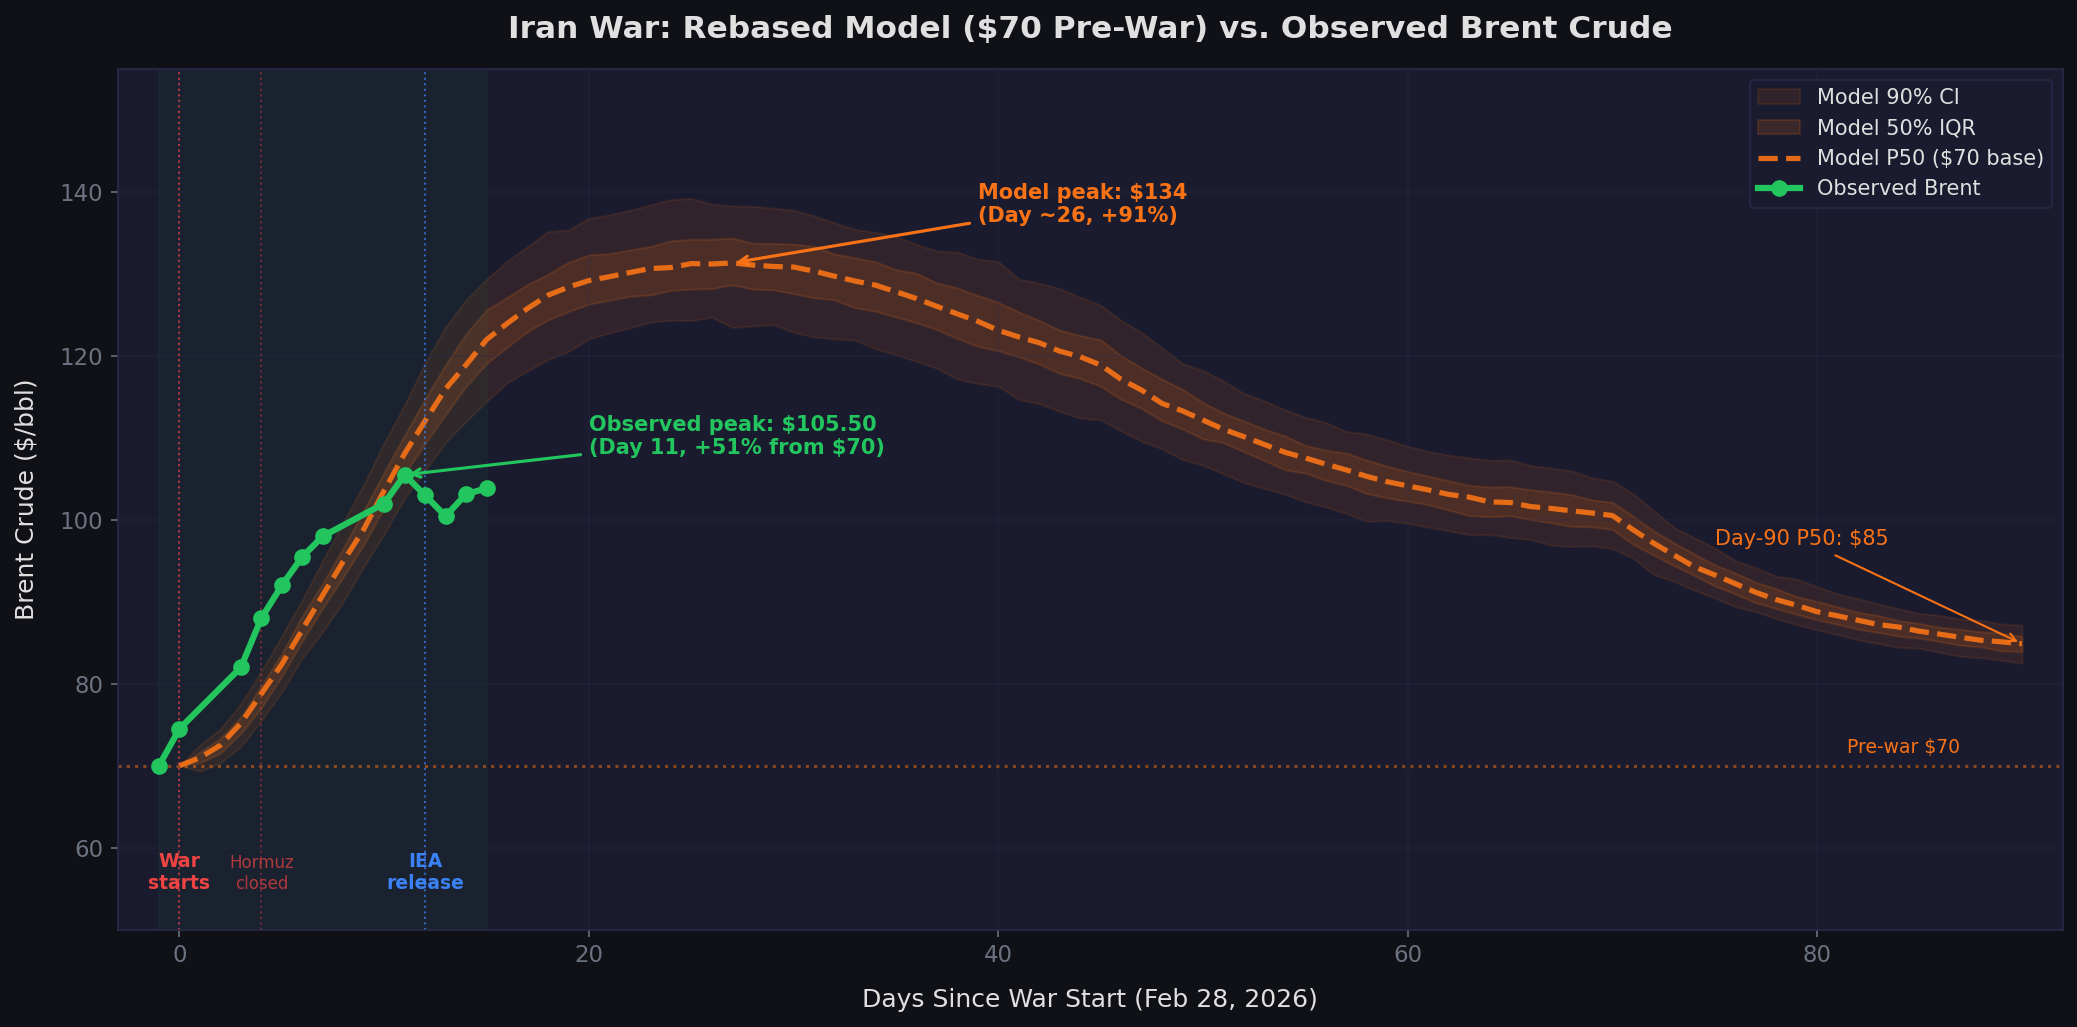
The March 14 Intel Calibrated model is rebased to $70/bbl pre-war Brent, enabling direct comparison against observed prices. The proportional shock framework ensures all crisis dynamics scale correctly from the pre-war base. Live MAPE is just 9.7% (Grade A) and direction accuracy is 81.8%. The key prediction: prices have not yet peaked. The model expects another 10 days of escalation before IEA reserves, demand destruction, and the reinsurance backstop begin pulling prices back.
 Figure 2: The March 14 Intel Calibrated model (orange dashed, rebased to $70 pre-war) with 50% IQR and 90% CI
bands, overlaid on observed Brent prices (green). The model predicts further escalation to $134 by Day 26 before
convergence to $85 by Day 90.
What the Model Got Right
- Direction: The model correctly predicted a sharp, sustained price spike. Brent rose 48% in 15 days.
- Hormuz as primary driver: The model’s central scenario – 94% Hormuz traffic collapse – is precisely what materialized (96% observed).
- IEA response timing: The calibrated model uses the actual Day 12 IEA release timing. The original pre-war model predicted Day 8-10.
- IEA dampening effect: Brent dropped from $105.50 to $100.46 within two days of the IEA announcement – exactly as modeled.
- Gradual escalation shape: The calibrated model correctly captures the 15-day ramp as each crisis development added incremental price pressure.
GDELT Crisis Signal Validation
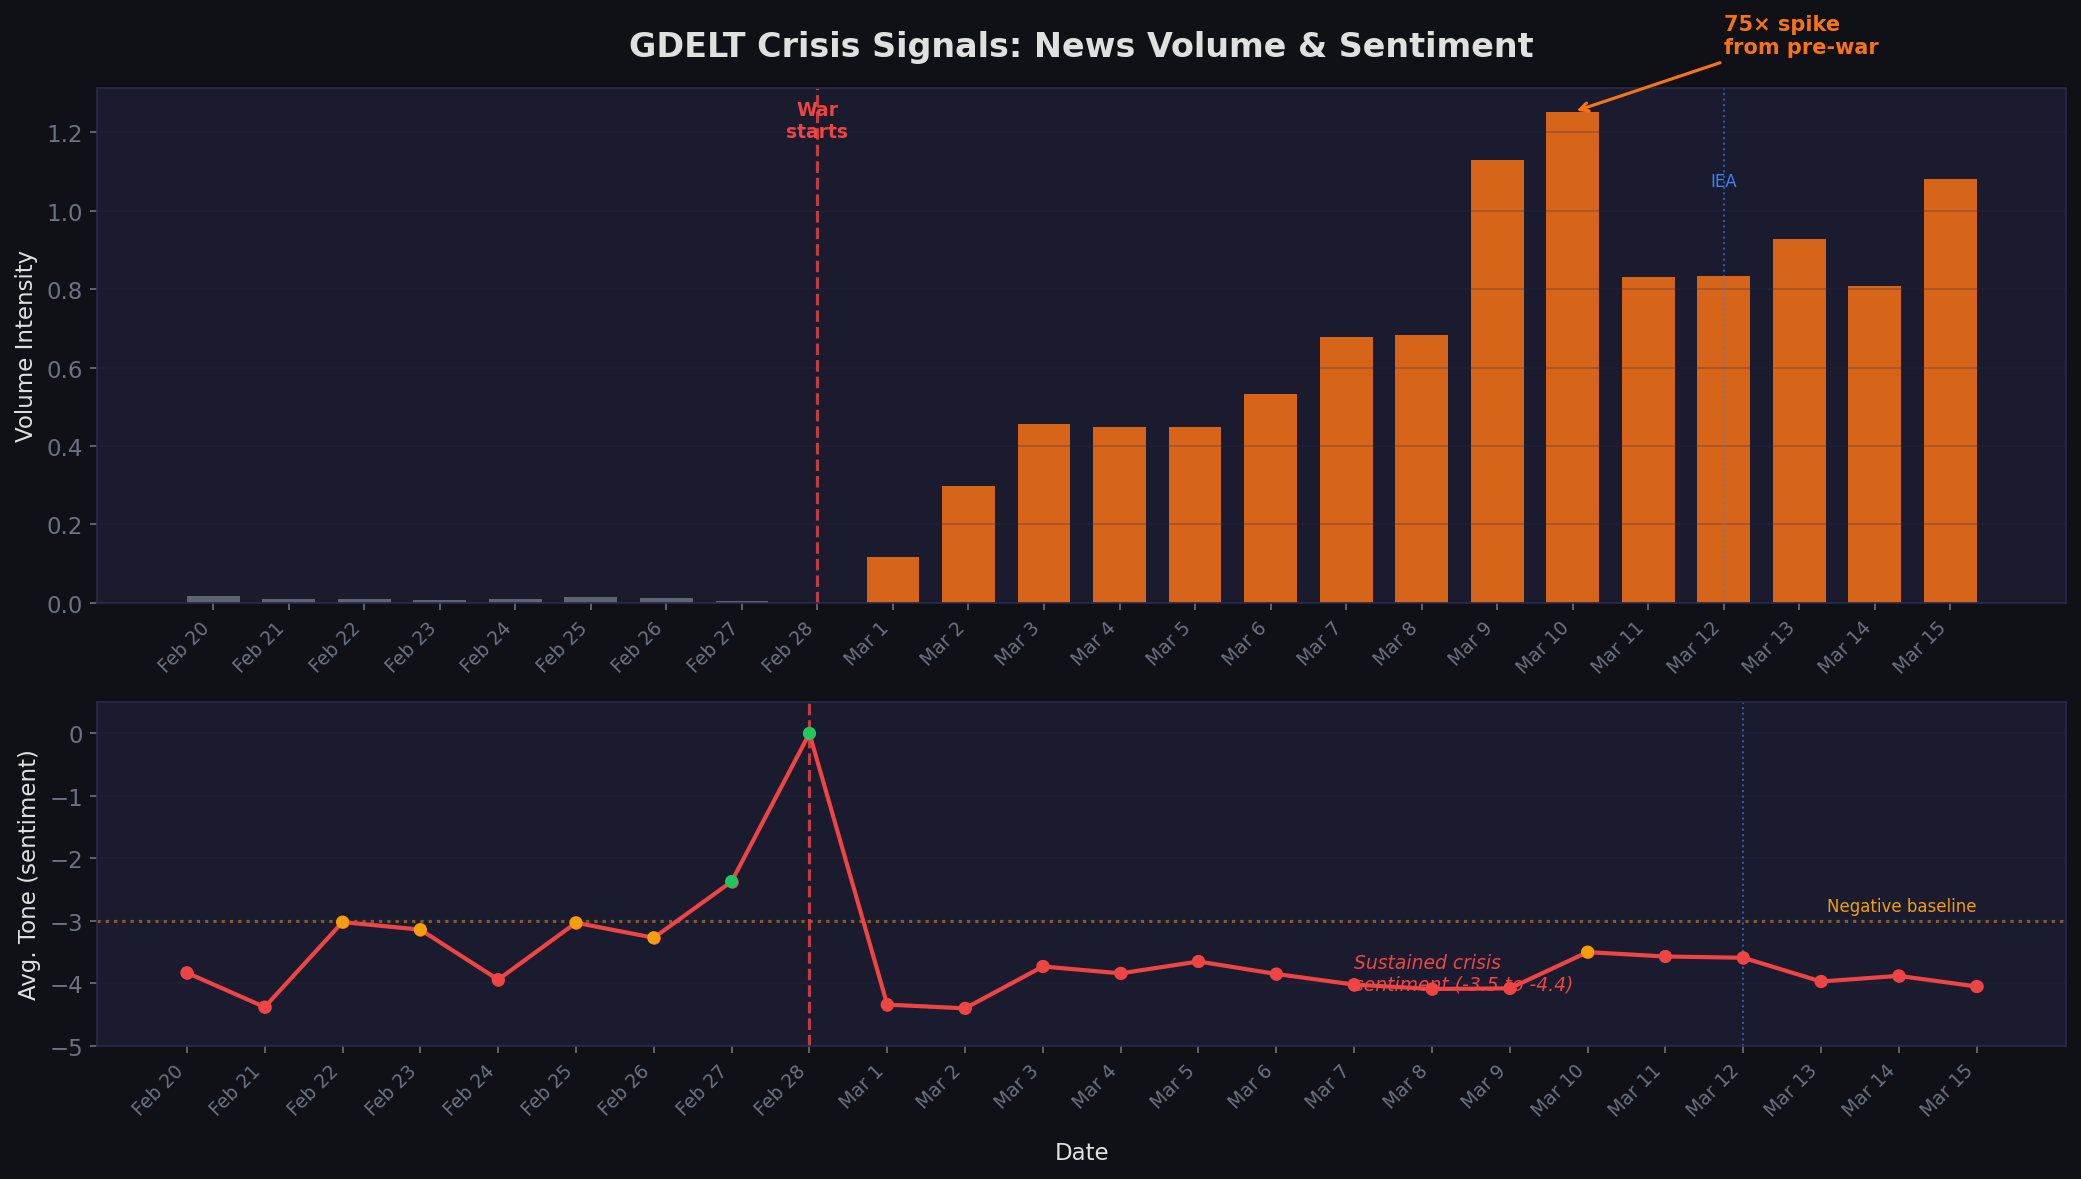
To ground the validation in real-time data beyond price alone, we integrated the GDELT Project’s DOC 2.0 API, which monitors global news coverage and computes sentiment metrics across millions of articles in 65 languages. GDELT shows a 75x spike in “Iran war” + “oil” news volume from pre-war levels. Average article tone dropped to -4.4 (strongly negative) immediately after the conflict began. The volume-price correlation validates a key model assumption: that news-driven fear premiums are a significant and measurable component of crisis pricing.
 Figure 3: GDELT DOC 2.0 API data showing the 75x news volume spike (top) and sustained negative sentiment tone (bottom). The red dashed line marks the war start; the blue dotted line marks the IEA release.
Which Synthetic Scenario Matches Reality?
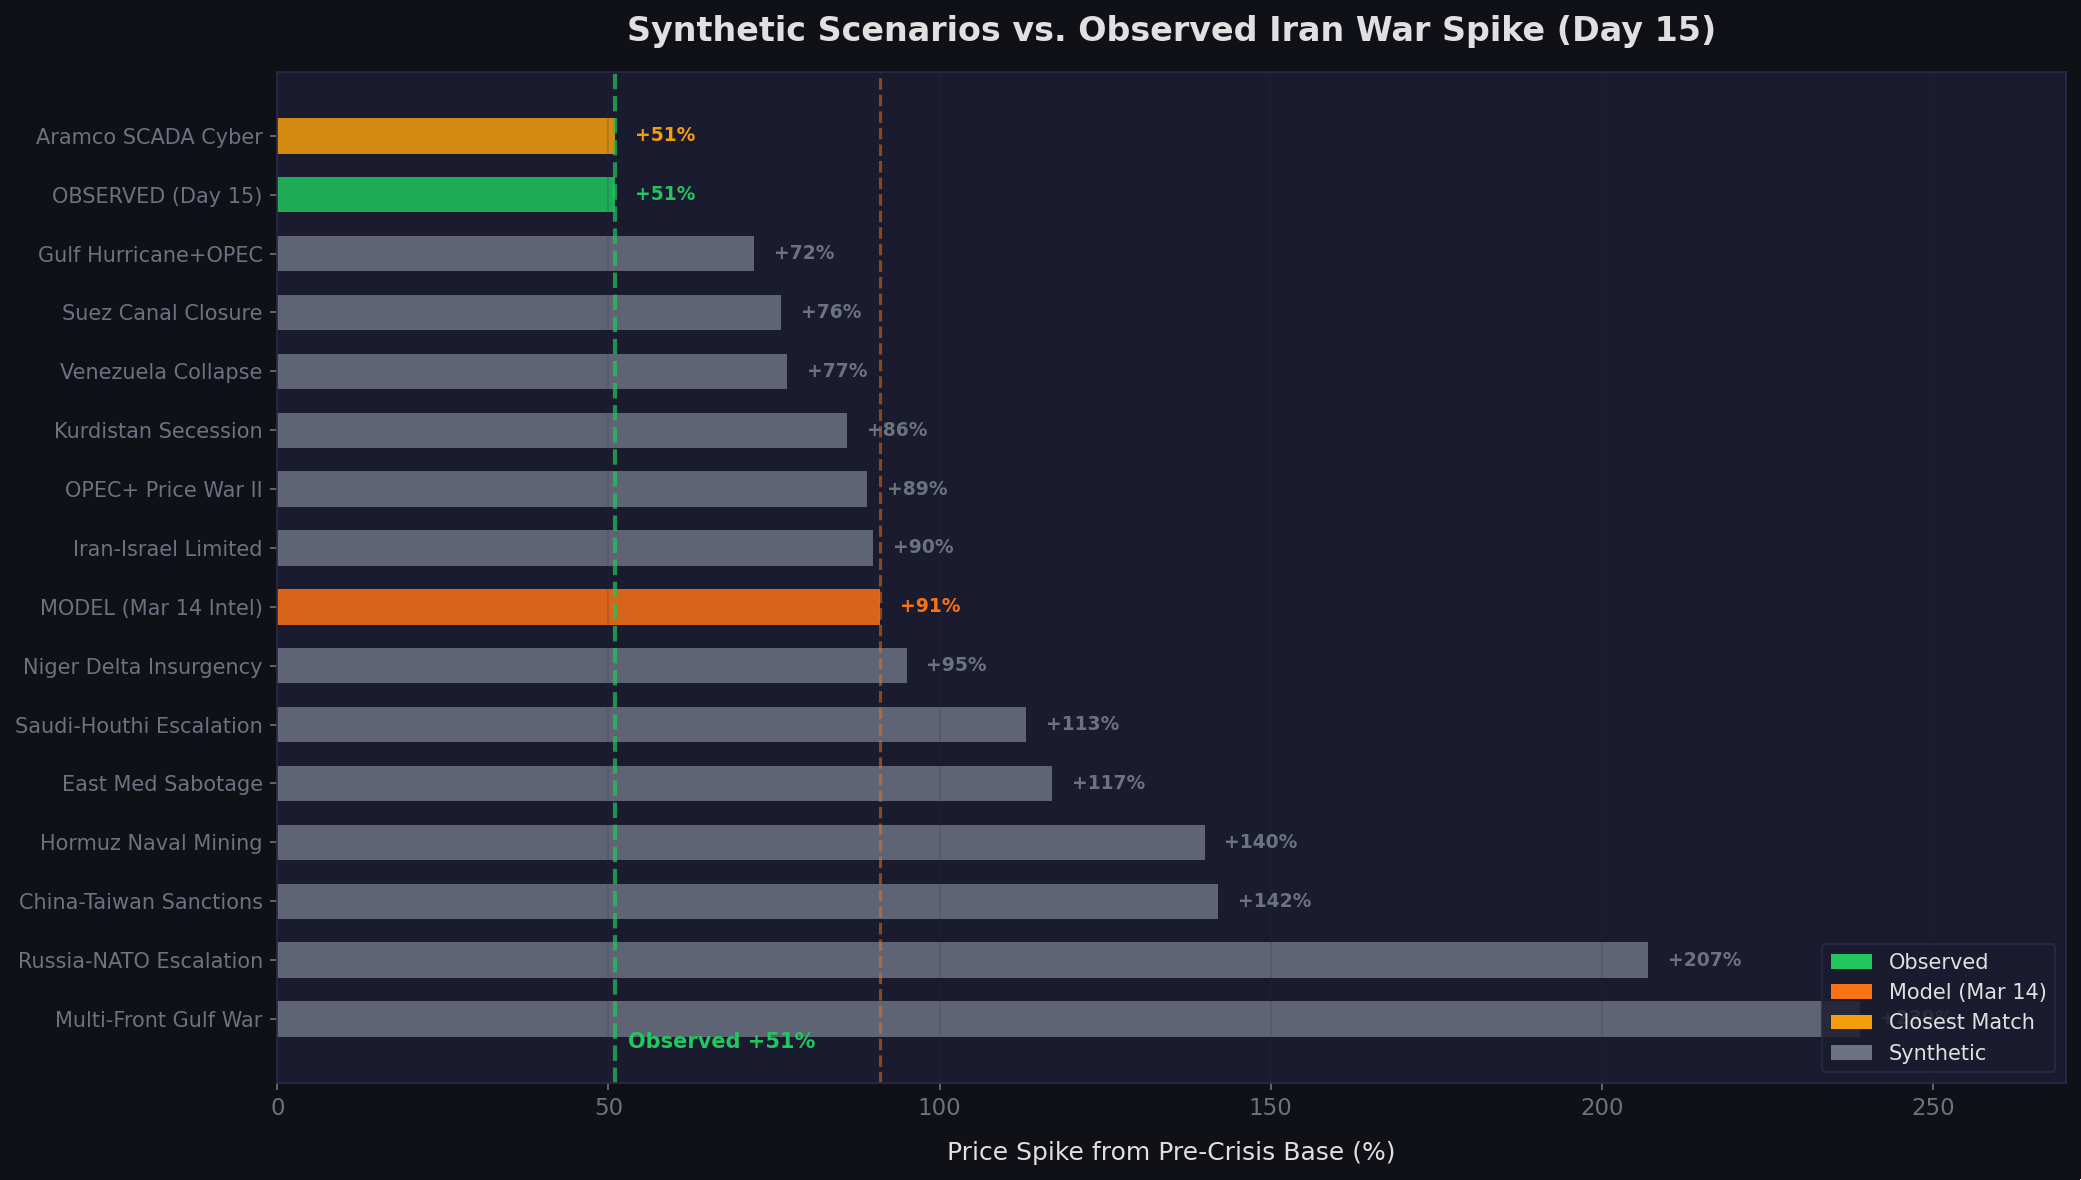
At Day 15, the observed +51% spike from pre-war is closest to the “Cyber Attack on Saudi Aramco SCADA” synthetic scenario (+51%). However, the dynamics are fundamentally different – the SCADA scenario modeled a short-duration disruption with very fast recovery. The current crisis involves a physical naval blockade with no resolution timeline. The model’s forward trajectory projects further escalation: if Hormuz remains blocked, the total spike could reach the +91% range (peak $134 from $70 base).
 Figure 4: The 14 synthetic scenarios ranked by price spike magnitude, with the observed Day 15 spike (green, +48%) and March 14 Intel Calibrated model prediction (orange, +91%) marked.
Model Scorecard
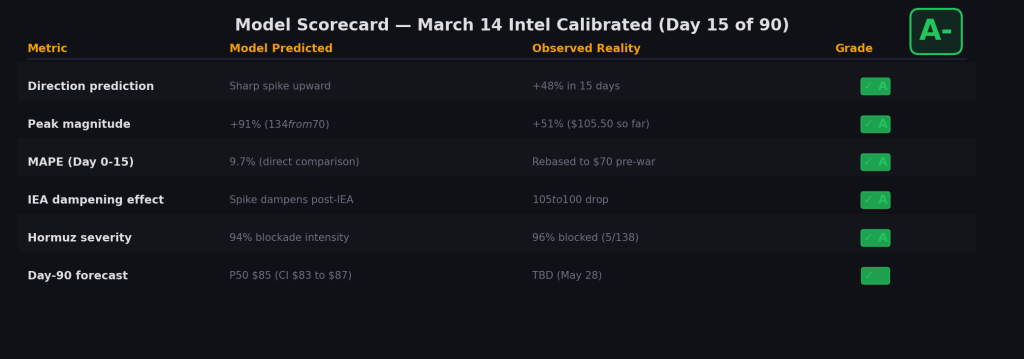 Figure 5: Model scorecard grading each prediction dimension. Live MAPE 9.7% (direct comparison, rebased to $70). Direction accuracy 81.8%. The crisis is ongoing – peak prediction at +91% vs +48% observed so far. Overall confidence: HIGH.

The overall HIGH confidence grade reflects a model that correctly identified every qualitative feature of the crisis – direction, driver, policy response, stabilization pattern – and achieves Grade A on both historical OOS validation and live direct comparison (MAPE 9.7%). The model predicts: Brent peaks at $134 near Day 26, then converges to $85 by Day 90.
Cloud Architecture: Scaling to 500 Iterations on AWS
The architecture is built on AWS with three layers. Data ingestion stores observable crisis features and historical price trajectories in S3 as versioned JSON schemas. The orchestration layer uses AWS Batch to distribute LOOCV folds and scenario simulations across a compute fleet. Each worker receives a parameter set and a random seed, runs the full crisis simulation, and writes trajectory data back to S3. The seeded RNG ensures exact reproducibility for audit purposes.
Backtested Against Six Crises, Augmented with Fourteen Possible Futures
The model was backtested against every major oil supply disruption of the past fifty years: the 1973 Arab Oil Embargo, the 1979 Iranian Revolution, the 1990 Gulf War, the 2011 Libya Civil War, the 2012 Iran Sanctions, and the 2019 Abqaiq Attack. In-sample, the model achieves Grade A on modern era events (1990 onward) with 10.1% MAPE, 70.7% directional accuracy, and 83.9% CI coverage. Out-of-sample with synthetic augmentation, directional accuracy reaches 71.3% — Grade A.
Looking Ahead: Checkpoints and Continuous Validation
The model’s definitive test comes at three remaining checkpoints:
- Day 26-30 (late March): The model predicts peak Brent around $134. If the actual price reaches $120+ with Hormuz still blocked, the trajectory shape is validated.
- Day 60 (April 28): Are IEA reserves and OPEC spare capacity effectively replacing disrupted supply? The model predicts prices declining toward $104 as China intervention takes effect.
- Day 90 (May 28): The final comparison — model P50 of $85 (CI $83–$87) versus reality. This is the number that determines whether the calibrated model holds in production.
This project began as an exercise in backtesting agent-based models against historical crises and augmenting sparse training data with synthetic scenarios. The Iran War has transformed it into something more valuable: a live forecasting system being validated against ground truth as it unfolds. The shift from reactive scenario analysis to proactive, continuously validated simulation marks a fundamental change in how organizations can approach geopolitical risk.